Real Estate Market Report - Vancouver, WA (Jan, 2024)
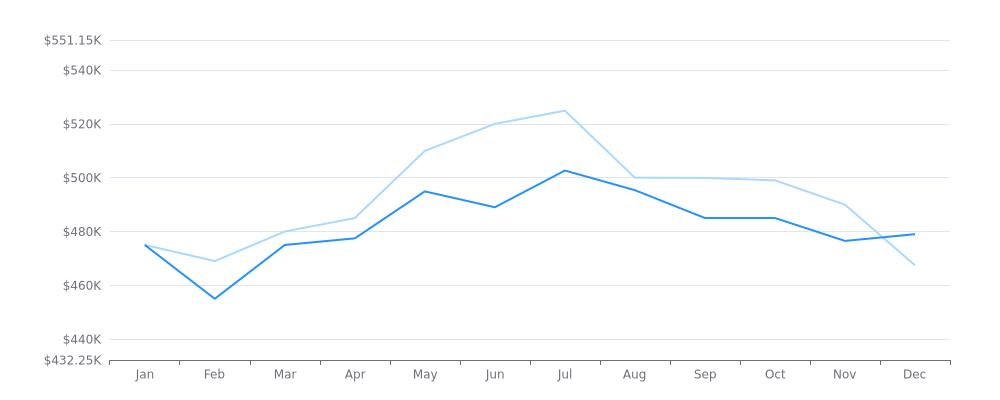
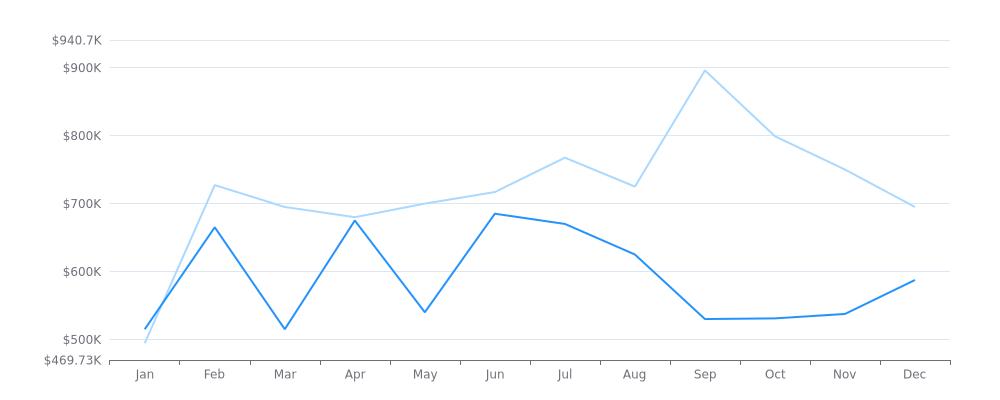
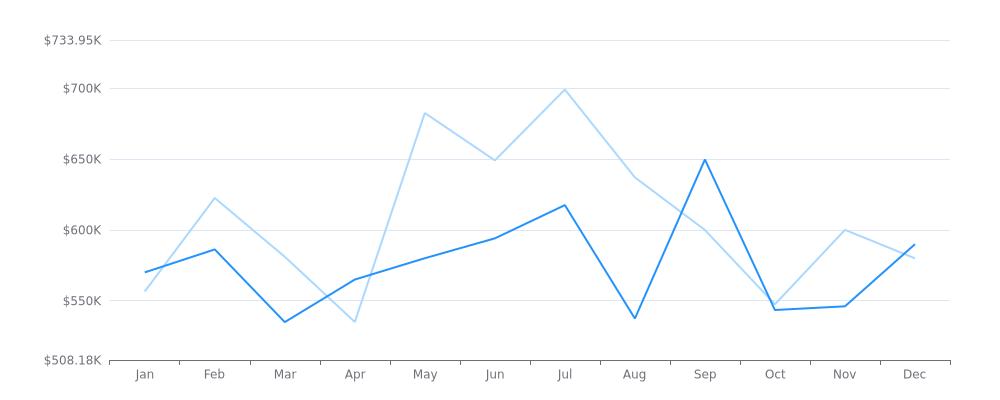
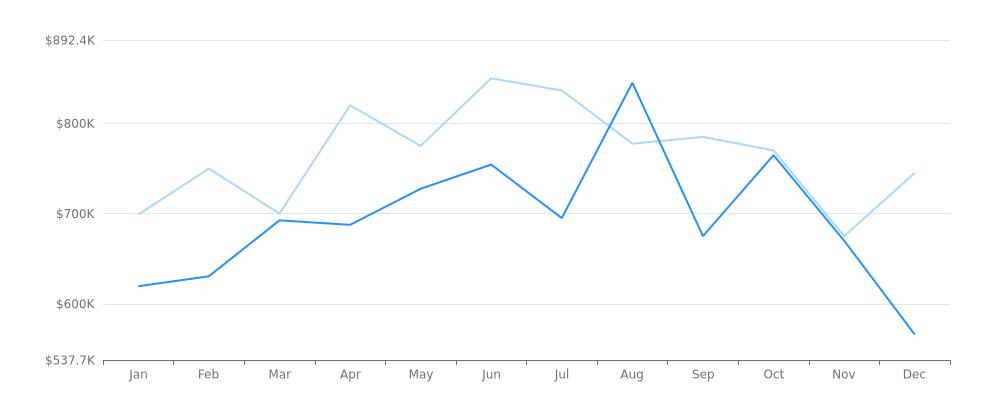
Current Market Condition 575 Active Listings 386 Pending Listings $510,000 Median List Price View Properties for Sale Find Out Your Home Value The median sale/list price for the given data seems to fluctuate throughout the year, with the highest point in May at $509,950 and the lowest in December at $467,450 in the first set of data. In the second set of data, the median sale/list price is more stable, staying around $485,000 for several months before increasing slightly to $502,650 in July. Median Sale/List Price List Price Sale Price The median sale price per square foot in January 2023 was $264.674, which gradually increased to $293.949 in July 2023. After that, it fluctuated but remained between $283.544 and $292.969 for the rest of the year. Median Sale Price per Square Foot The median sale price to list price ratio for the year 2023 remains consistently high at 1.0, except for January where it is slightly lower at 0.991. This suggests that homes are generally selling very close to or at their original listed price. Median Sale Price to List Price Ratio The data shows a steady increase in the number of properties sold/listed from January to June, with a peak in May and June for both categories. However, there is a decline in the number of properties listed/sold from July to December, with a significant drop in December. Overall, more properties were sold than listed throughout the year. Properties Sold/Listed Properties Listed Properties Sold The median days on the market for properties in the given area started at 62 days in January 2023, gradually decreased to 35 days in May, and then increased to 54 days by December. The lowest median days on the market was in April at 38 days, while the highest was in January at 62 days. Median Days on Market
Read MoreReal Estate Market Report - Vancouver, WA (Nov, 2023)
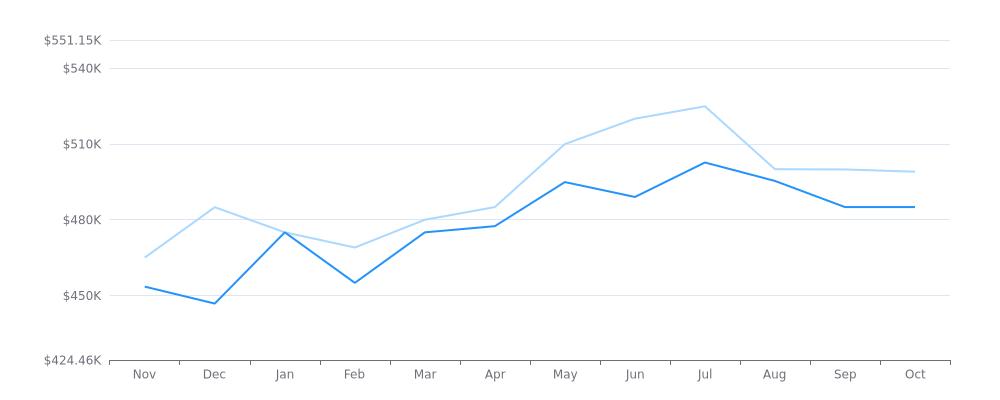
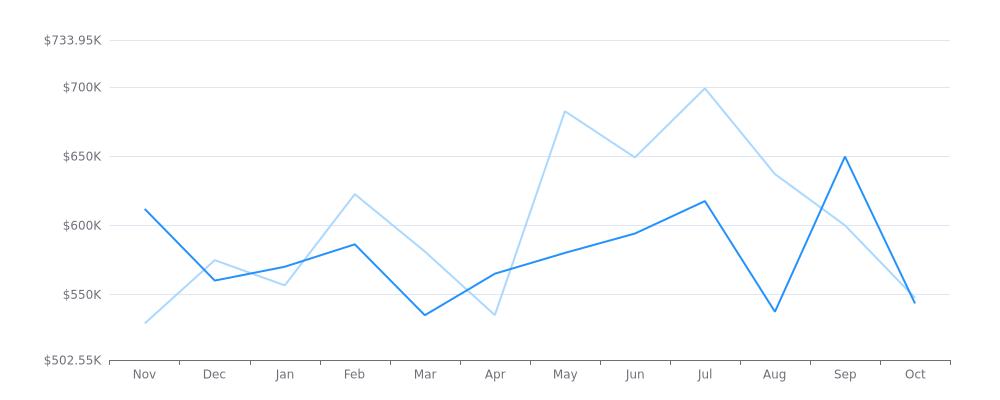
Current Market Condition 782 Active Listings 429 Pending Listings $525,000 Median List Price View Properties for Sale Find Out Your Home Value The median sale/list price for the first set of data ranges from $465,000 in November 2022 to $499,000 in October 2023, with a peak of $524,900 in July 2023. The second set of data shows a lower median sale/list price, ranging from $446,800 in December 2022 to $502,650 in July 2023, with a peak of $494,900 in May 2023. Median Sale/List Price List Price Sale Price The median sale price per square foot shows a clear upward trend from November 2022 to March 2023, peaking at 278.835 in March before dipping slightly in April and May. However, it then spikes again in July to reach 293.949, then drops again slightly in August and September before plateauing around 288.96 in October. Median Sale Price per Square Foot The median sale price to list price ratio is expected to be consistently at or very close to 1.0 for the next year, indicating that the median sale price of homes is likely to match or exceed the list price. This suggests a strong seller's market with high demand and potentially limited supply. Median Sale Price to List Price Ratio The first set of data shows the number of properties sold/listed increasing steadily from November 2022 to May 2023, with the highest count being 599 in June 2023, before gradually decreasing in the following months. The second set of data shows a slightly different trend, with a peak in December 2022 and a dip in January 2023, before gradually increasing and then decreasing towards the end of the period. Overall, there seems to be a healthy level of activity in the property market over this time period. Properties Sold/Listed Properties Listed Properties Sold The median days on the market for homes is expected to decrease over the next few months, reaching a low of 35 days in May 2023, before increasing slightly in the summer and fall. However, even in October 2023, the median days on the market is still projected to be below 50 days. Median Days on Market
Read More
Categories
Recent Posts
